Understanding Trading View: Overview and Benefits
In the fast-paced world of financial markets, having reliable, comprehensive, and real-time charting tools is essential for traders and investors aiming to make informed decisions. trading view stands out as a leading platform that combines advanced technical analysis with social networking features, creating an ecosystem tailored for modern traders. Whether you’re a beginner just starting to explore market charts or a seasoned professional seeking sophisticated tools, Trading View offers a versatile environment that caters to various analytical needs.
What is Trading View and How Does It Serve Traders?
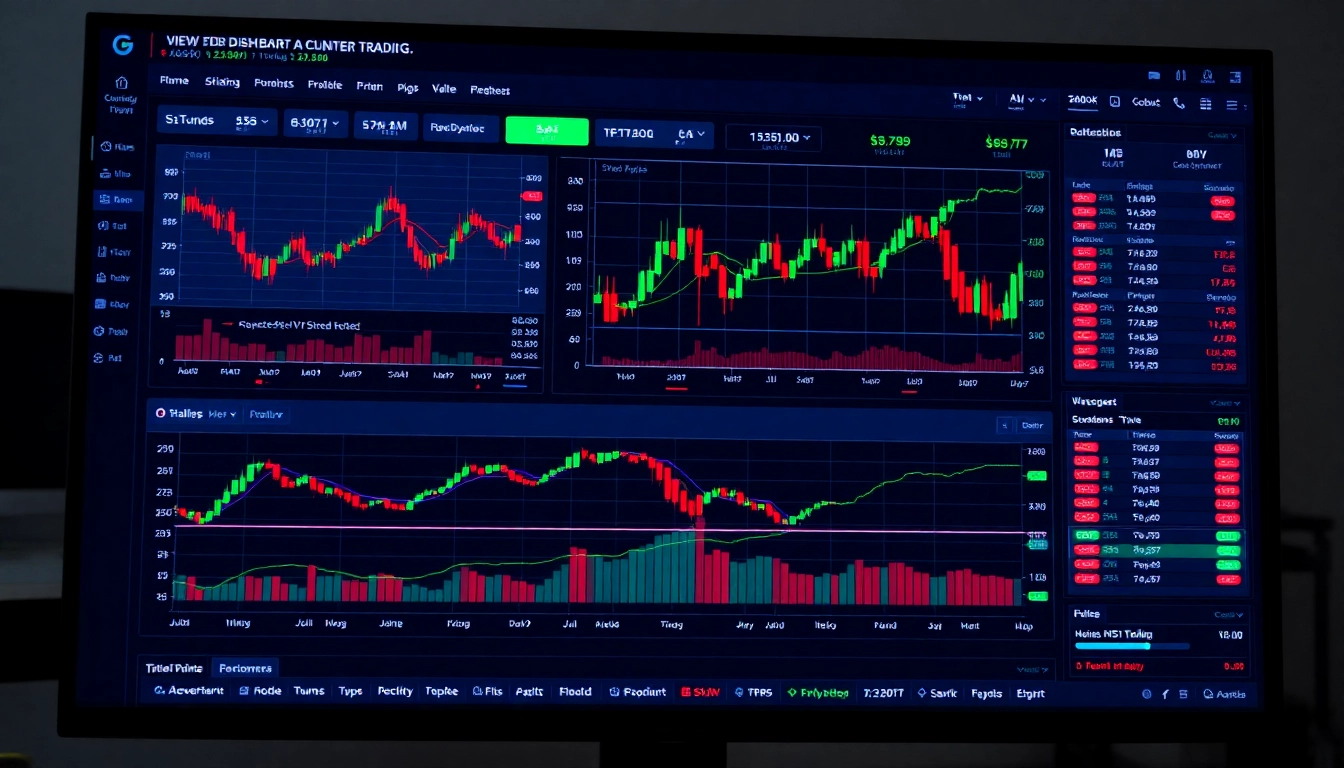
Trading View is a sophisticated financial analysis platform that provides dynamic charting, data visualization, and social engagement. It is both a website and a mobile app, enabling traders to track multiple markets—including stocks, cryptocurrencies, forex, commodities, and indices—simultaneously. The platform’s real-time data feeds, customizable charts, and collaborative features have made it a favorite among the trading community worldwide. Its integration of social tools allows users to share ideas, discuss strategies, and analyze market conditions collectively, making it more than just a charting tool but a comprehensive social trading network.
Key Features That Enhance Market Analysis
- Advanced Charting Tools: Trading View offers highly customizable, interactive charts with hundreds of indicators, drawing tools, and timeframes. Traders can build complex technical models to identify precise entry and exit points.
- Multi-Market Data Integration: Users can track diverse asset classes through a unified platform—cryptocurrencies, stocks, forex pairs, commodities, and indices—helping to develop a holistic market view.
- Real-Time Alerts and Notifications: Automated alerts notify traders of significant price moves or pattern formations, enabling immediate action regardless of location.
- Community and Social Trading Features: Share ideas, view others’ analysis, and participate in discussions. This social aspect enhances learning and collaborative decision-making.
- Script and Automation: Pinescript, Trading View’s proprietary scripting language, allows traders to create custom indicators and automate strategies for more efficient trading.
Comparing Trading View with Other Charting Platforms
While there are numerous charting platforms available, Trading View distinguishes itself through its combination of high-quality technical analysis tools and vibrant social features. Unlike standalone software such as MetaTrader or ThinkorSwim, Trading View is accessible directly from the browser and supports seamless device synchronization. Additionally, its community-driven approach fosters a cooperative environment unlike proprietary platforms that focus solely on individual analysis. Its intuitive interface, free tier access, and extensive library of scripts also make it particularly appealing for traders seeking both depth and ease of use.
Getting Started with Trading View
Creating Your Account and Navigating the Dashboard
Getting started is straightforward: visit the official Trading View website, sign up with an email or social media account, and explore the user-friendly dashboard. The homepage features watchlists, recent ideas, trending assets, and quick access to charting tools. Once logged in, users can customize their interface by arranging panels, saving favorite layouts, and setting default workspace configurations. The intuitive navigation allows even newcomers to access advanced features with minimal learning curve.
Customizing Charts and Setting Up Watchlists
Personalization begins with selecting the assets of interest. Users can create watchlists for stocks, cryptocurrencies, or other assets by searching symbols and adding them to their lists. The platform supports pairs, indices, commodities, and more. Charts are highly customizable—change styles, color themes, indicators, and timeframes with simple clicks. Saved templates enable quick switching between analysis setups, which is crucial for monitoring multiple markets and implementing strategies efficiently.
Using Basic Indicators for Initial Market Analysis
For beginners, basic technical indicators such as Moving Averages, Relative Strength Index (RSI), MACD, and Bollinger Bands serve as foundational tools. These indicators help identify trends, overbought or oversold conditions, and potential reversals. Exploring how these tools interact on different assets’ charts builds a solid understanding of market behavior. Trading View makes it effortless to overlay multiple indicators, adjust parameters, and interpret signals, thus supporting novice traders in developing confidence.
Advanced Trading View Techniques for Better Investment Decisions
Implementing Technical Analysis Strategies
Advanced traders leverage a variety of technical analysis techniques within Trading View, including Elliott Wave Theory, Fibonacci retracements, and pattern recognition. Using these methods on detailed charts helps pinpoint lucrative entry points and manage risk. For example, Fibonacci levels can identify support and resistance zones, while pattern recognition tools allow traders to spot head-and-shoulders or double bottoms with precision. Incorporating multiple strategies enhances confidence in trade setups and reduces emotional decision-making.
Leveraging Social Trading and Community Ideas
The social component of Trading View allows traders to publish their analysis and follow ideas shared by others. Reviewing community ideas exposes traders to diverse perspectives and innovative strategies. By analyzing well-reviewed ideas and commenting on posts, traders can refine their understanding of market movements and validate personal analyses. This interactive environment also offers opportunities for mentorship and learning from seasoned experts, giving newcomers access to collective wisdom and real-world insights.
Automating Alerts and Integrating Trading Bots
Automation is a key to efficient trading. Trading View’s alert system can monitor indicators, price levels, or pattern formations and notify traders instantly—via SMS, email, or platform notifications. Advanced users can develop Pinescript strategies to automate regular analyses or even integrate with external trading bots through API connections. These tools enable near real-time execution and consistent strategy application, removing manual delays and emotional biases.
Optimizing Trading Performance with Trading View
Analyzing Historical Data for Trend Identification
Reviewing historical data enables traders to identify recurring patterns and long-term trends. Trading View provides extensive chart archives, allowing for back-testing strategies and understanding historical volatility. By analyzing past fluctuations, traders can set realistic expectations and diversify risk. Incorporating volume data alongside price movements enhances the accuracy of trend assessments and assists in confirming breakout signals.
Applying Risk Management and Exit Strategies
An effective trading system incorporates predefined stop-loss and take-profit levels. Trading View facilitates this by enabling traders to mark exit points clearly on charts and set automated alerts. Robust risk management reduces losses and preserves capital, critical especially when markets are volatile. Using visual tools on the platform promotes disciplined trading and improves overall trading psychology.
Tracking Performance Metrics and Improving Strategies
Performance evaluation metrics such as win rate, risk-reward ratio, and trade duration are vital for continuous improvement. Trading View’s ability to save trade records and analyze performance graphs helps traders refine their strategies over time. Regular assessments lead to adjustments in indicator settings, risk parameters, and trading frequency, ensuring adaptation to evolving market conditions.
Future Trends and Innovations in Trading View Technology
Emerging Features and Updates to Watch
As technology advances, Trading View is expected to introduce new features, such as enhanced AI-powered analysis, more robust automation tools, and expanded support for emerging asset classes like NFTs and decentralized finance (DeFi). Continuous platform updates aim to improve speed, user interface, and analytical depth—keeping traders at the forefront of technological innovation.
Integrating AI and Machine Learning Tools
Artificial intelligence and machine learning can revolutionize market analysis by predicting price movements, optimizing portfolios, and automating intricate trading strategies. Trading View’s future plans include integrating these tools directly into the platform, providing traders with smarter insights and more accurate forecasts. Such developments will enable users to leverage data-driven decision-making and stay ahead in competitive markets.
Enhancing User Experience Through Platform Integration
To maximize usability, Trading View will likely deepen integration with brokerage accounts, portfolio management tools, and real-time news feeds. This interconnectedness ensures traders have all necessary information within a single ecosystem, reducing friction and improving execution speed. Enhanced mobile versions and customizable notification settings will further improve user experience and accessibility worldwide.


